
PMON主要做的事情包括连接进程异常中止后的资源清理,后台进程状态的监控与恢复,以及将实例注册到Listener上。本文通过一些调试例子来分析背后的工作原理。
连接进程的异常清理
我们使用10246事件来调试。由于10246只能用在initSID.ora中而不能动态地alter system,因此我们通过pfile方式启动数据库,启动前先在initSID.ora文件中加入这样的调试参数:
1
event='10246 trace name context forever, level 10'
服务器上启动数据库并确认Event生效。
1
2
3
4
5
6
7
8
9
10
11
12
13
14
15
[oracle@localhost ~]$ sqlplus sys/oracle as sysdba

idle> startup
ORACLE instance started.
...
Database mounted.
Database opened.


idle> show parameter event

NAME           TYPE    VALUE
-----------------------------------------------------------------
event          string  10246 trace name context forever, level 10
xml_db_events  string  enable
在远程的客户机器上连接
1
2
3
4
5
6
7
8
9
10
11
12
13
14
15
16
17
C:\Users\JC>whoami
chen-pc\jc

C:\Users\JC>net view /domain
Domain

-------------------------------------
ORADEV
命令成功完成。


C:\Users\JC>sqlplus agile/tartan@lxagile9

SQL> select 1 from dual;
		 1
----------
		 1
由于是Dedicated Server连接模式,我们在客户机器上获取服务器端的Dedicated Server Conneciton 进程,客户进程,session id, session serial 以及session_paddr
1
2
3
4
5
6
7
SQL> select p.spid server_ospid, s.process client_ospid, s.sid session_id, s.ser
ial# session_serial, s.paddr session_paddr from v$process p, v$session s where p
.addr=s.paddr and s.sid=(select sid from v$mystat where rownum=1);

SERVER_OSPID  CLIENT_OSPID  SESSION_ID  SESSION_SERIAL  SESSION_PADDR
------------------------------------------------------------------------
	   21374     7640:7644          11              12       3DFA87FC
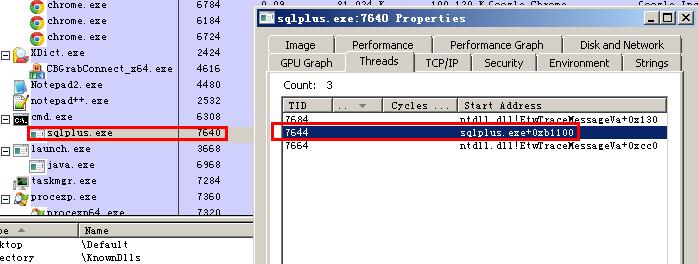
其中Client_OSPID在windows环境中显示为7640:7644的格式,如果是Unix,将显示一个独立的整数作为SQLPLUS进程。在Windows上,7460为SQLPLUS的进程,7644为其中的线程。我们可以使用Process Explorer观察到。
切换到服务器上,kill掉21374进程,此进程为服务于客户端请求的Dedicated Server Connection进程。
1
2
3
4
5
6
7
8
idle> host
[oracle@localhost ~]$ ps -ef|grep 21374
oracle   21374     1  0 17:47 ?        00:00:00 oracleagile9 (LOCAL=NO)
oracle   21397 21381  0 17:48 pts/1    00:00:00 grep 21374

[oracle@localhost ~]$ kill -9 21374

[oracle@localhost ~]$ exit
回到客户端,做DML查询出错。
1
2
3
4
5
6
7
SQL> select 1 from dual;
select 1 from dual
*
第 1 行出现错误:
ORA-03113: 通信通道的文件结尾
进程 ID: 21374
会话 ID: 11 序列号: 12
此时,Oracle发出中断异常,交由PMON立即去处理去做清理。我们打开trace文件会注意到PMON的清理动作。
1
2
3
4
5
idle> show parameter background_dump_dest

NAME                    TYPE   VALUE
---------------------------------------------------------
background_dump_dest  string   /u01/app/oracle/diag/rdbms/agile9/agile9/trace
.
1
2
3
4
5
6
7
8
9
10
11
12
13
Trace file /u01/app/oracle/diag/rdbms/agile9/agile9/trace/agile9_pmon_21305.trc
...
*** 2013-03-16 17:49:20.938
marked process 0x3dfa87fc pid=22 serial=5 ospid = 21374 dead
  client details:
	O/S info: user: JC, term: CHEN-PC, ospid: 7640:7644
	machine: ORADEV\CHEN-PC program: sqlplus.exe
	application name: SQL*Plus, hash value=3669949024

*** 2013-03-16 17:49:20.938
deleting process 0x3dfa87fc pid=22 serial=5 priority=0
deleting session 0x3d970a50 sid=11 serial=12
deletion of process 3dfa87fc pid=22 seq=5 successful
PMON删除了会话并清理了物理连接进程,释放资源。
后台进程状态的监控
此过程我们模拟人为地kill掉Oracle重要的DBWn进程。此进程一旦异常停止,实例将测底停止。
1
2
3
4
5
6
7
8
9
10
11
idle> host
[oracle@localhost ~]$ ps -ef | grep ora_ | grep $ORACLE_SID
oracle   21305     1  0 17:45 ?        00:00:00 ora_pmon_agile9
oracle   21307     1  0 17:45 ?        00:00:00 ora_vktm_agile9
...
oracle   21323     1  0 17:45 ?        00:00:00 ora_dbw0_agile9
oracle   21325     1  0 17:45 ?        00:00:00 ora_lgwr_agile9
oracle   21327     1  0 17:45 ?        00:00:00 ora_ckpt_agile9
oracle   21329     1  0 17:45 ?        00:00:00 ora_smon_agile9
...
oracle   21508     1  0 18:01 ?        00:00:00 ora_w000_agile9
.
1
2
[oracle@localhost ~]$ kill -9 21323
[oracle@localhost ~]$ exit
然后,在服务器上做DML查询,出现ORA-03135错误。注意这里的Process ID: 21341,这个是当前的连接进程。
1
2
3
4
5
6
7
idle> select 1 from dual;
select 1 from dual
*
ERROR at line 1:
ORA-03135: connection lost contact
Process ID: 21341
Session ID: 125 Serial number: 5
查看PMON的trace文件,PMON检测到DBW0终止了
1
2
3
4
5
6
7
8
9
10
11
12
13
14
15
16
17
18
19
20
21
22
23
24
25
26
27
28
29
30
31
32
33
34
35
36
37
38
39
40
41
42
43
44
45
46
47
48
49
50
51
52
53
54
55
56
57
58
59
60
61
62
63
64
65
66
67
68
69
70
71
72
73
74
75
76
77
78
79
80
81
82
83
84
85
86
87
88
89
90
91
92
93
94
95
96
97
98
99
100
101
102
103
104
105
106
Background process DBW0 found dead

*** 2013-03-16 18:02:36.901
Oracle pid = 10
OS pid (from detached process) = 21323
OS pid (from process state) = 21323
dtp = 0x2000d868, proc = 0x3dfa05dc
Dump of memory from 0x2000D868 to 0x2000D8A0
2000D860                   00000040 3DFA05DC          [@......=]
2000D870 00000000 00000000 30574244 00000200  [........DBW0....]
2000D880 0000534B 0D898AFA B6EA36C0 0000534B  [KS.......6..KS..]
2000D890 0D898AFA 00000001 2721298A 00010000  [.........)!'....]
Dump of memory from 0x3DFA05DC to 0x3DFA10B4
3DFA05D0                            00000301              [....]
3DFA05E0 00000302 00000000 3DFA05DC 3DFA05EC  [...........=...=]
3DFA05F0 3DFA05EC 00000000 00000000 00000000  [...=............]
3DFA0600 00000000 00000000 00000019 3CE4A084  [...............<]
3DFA0610 3D134570 3DB13248 3D133848 00000000  [pE.=H2.=H8.=....]
3DFA0620 3D1338BC 3D1338BC 3D134560 00000601  [.8.=.8.=`E.=....]
3DFA0630 00000000 3D9808D8 3DB13248 0000000A  [.......=H2.=....]
3DFA0640 00000000 0000000A 00000001 874B9F64  [............d.K.]
3DFA0650 3A79CCE4 00000000 00000000 00000000  [..y:............]
3DFA0660 00000000 3D778FDC 3D7790C0 00000000  [......w=..w=....]
3DFA0670 00000000 00000000 00000000 00000000  [................]
		Repeat 3 times
3DFA06B0 00030000 00000000 00030000 00000000  [................]
3DFA06C0 00030000 00000000 00040000 00000000  [................]
3DFA06D0 00030000 00000000 00030000 00000000  [................]
3DFA06E0 00030000 00000000 00040000 00000000  [................]
3DFA06F0 00030000 00000000 00000000 00000000  [................]
3DFA0700 00000000 00000000 00000000 00000000  [................]
		Repeat 1 times
3DFA0720 00040000 00000000 00000000 00000000  [................]
3DFA0730 00000000 00000000 00000000 00000000  [................]
3DFA0740 00000000 51443F56 00000000 00000000  [....V?DQ........]
3DFA0750 00000000 00000000 00000000 0000012C  [............,...]
3DFA0760 00000000 00000000 3DFA0768 3DFA0768  [........h..=h..=]
3DFA0770 00000000 00000001 FFFFFFFF 3DFA077C  [............|..=]
3DFA0780 3DFA077C 00000000 00000000 00000000  [|..=............]
3DFA0790 00000000 00000000 00000000 00000000  [................]
3DFA07A0 00000000 00000023 0000001B 00000009  [....#...........]
3DFA07B0 00000011 3DFA51C4 3DFA51C4 00010000  [.....Q.=.Q.=....]
3DFA07C0 00000000 00000000 00000000 00000000  [................]
		Repeat 1 times
3DFA07E0 00000000 00000000 00000000 0000534B  [............KS..]
3DFA07F0 00000000 00000000 00000000 00000000  [................]
		Repeat 2 times
3DFA0820 00000000 00000000 00000000 3DFA05DC  [...............=]
3DFA0830 00000000 00000000 00000000 00000000  [................]
		Repeat 8 times
3DFA08C0 00000000 00000000 51443F56 00000000  [........V?DQ....]
3DFA08D0 00000000 00000000 00000000 3DFA08DC  [...............=]
3DFA08E0 3DFA08DC 00000000 00000000 00000001  [...=............]
3DFA08F0 00000000 00000000 000B8002 0000000E  [................]
3DFA0900 0000534B 0D898AFA B6EA36C0 0000534B  [KS.......6..KS..]
3DFA0910 0D898AFA 00000000 3DFA091C 00000000  [...........=....]
3DFA0920 00000000 00000000 00000000 00000000  [................]
3DFA0930 00000000 00000000 00000000 00000003  [................]
3DFA0940 FFFFFFFF 00000000 00000000 00000000  [................]
3DFA0950 00000000 00000000 00000000 00000000  [................]
		Repeat 6 times
3DFA09C0 00000000 00000000 00000000 6361726F  [............orac]
3DFA09D0 0000656C 00000000 00000000 00000000  [le..............]
3DFA09E0 00000000 00000000 00000000 00000006  [................]
3DFA09F0 61636F6C 736F686C 6F6C2E74 646C6163  [localhost.locald]
3DFA0A00 69616D6F 0000006E 00000000 00000000  [omain...........]
3DFA0A10 00000000 00000000 00000000 00000000  [................]
		Repeat 1 times
3DFA0A30 00000015 00000000 4E4B4E55 004E574F  [........UNKNOWN.]
3DFA0A40 00000000 00000000 00000000 00000000  [................]
3DFA0A50 00000000 00000000 00000007 32333132  [............2132]
3DFA0A60 00000033 00000000 00000000 00000000  [3...............]
3DFA0A70 00000000 00000005 6361726F 6C40656C  [........oracle@l]
3DFA0A80 6C61636F 74736F68 636F6C2E 6F646C61  [ocalhost.localdo]
3DFA0A90 6E69616D 42442820 00293057 00000000  [main (DBW0).....]
3DFA0AA0 00000000 00000000 00000023 30574244  [........#...DBW0]
3DFA0AB0 00000000 00000002 00000000 00000000  [................]
3DFA0AC0 00000000 00000000 00000000 00000000  [................]
		Repeat 8 times
3DFA0B50 00000000 00000000 00000000 00000200  [................]
3DFA0B60 00000000 00000000 00000000 00000000  [................]
3DFA0B70 3D839920 3DFA164C 3DFA009C 00000000  [ ..=L..=...=....]
3DFA0B80 00000000 3D6C28CA 00000000 00000000  [.....(l=........]
3DFA0B90 00000000 00000000 00000000 00000000  [................]
3DFA0BA0 00000000 3DFA0BA4 3DFA0BA4 01CF0000  [.......=...=....]
3DFA0BB0 01CA0000 00417E2C 00451EE0 02107E2C  [....,~A...E.,~..]
3DFA0BC0 00000000 00000000 00000000 00000000  [................]
3DFA0BD0 00000000 00000000 00000814 00000000  [................]
3DFA0BE0 00000088 00000000 00000814 00000000  [................]
3DFA0BF0 00000000 00000000 00000000 00000000  [................]
		Repeat 2 times
3DFA0C20 00000000 00000000 0A000100 B9F6E000  [................]
3DFA0C30 00000000 01000000 00000000 00000000  [................]
3DFA0C40 00000000 00000000 00000000 00000000  [................]
3DFA0C50 00000000 00000005 00000000 00000000  [................]
3DFA0C60 00000000 00000000 00000000 00000000  [................]
		Repeat 67 times
3DFA10A0 3DFA10A0 3DFA10A0 00000000 3DFA10AC  [...=...=.......=]
3DFA10B0 3DFA10AC                             [...=]

*** 2013-03-16 18:02:36.903
PMON (ospid: 21305): terminating the instance due to error 471

*** 2013-03-16 18:02:46.933
Instance termination failed to kill one or more processes
ksuitm_check: OS PID=21341 is still alive
PMON关闭了几乎全部的进程,只剩下21341进程,此为当前的SQL连接在服务器上的进程。
在alert log中,也能看到几乎一样的信息提示。
1
2
3
4
5
6
Sat Mar 16 18:02:36 2013
PMON (ospid: 21305): terminating the instance due to error 471
Termination issued to instance processes. Waiting for the processes to exit
Sat Mar 16 18:02:46 2013
Instance termination failed to kill one or more processes
Instance terminated by PMON, pid = 21305
上述的信息中均提到了 error 471。其实它就是ORA-000471错误。
1
2
3
ORA-00471: DBWR process terminated with error
Cause:	 The database writer process died
Action:	 Warm start instance
将实例注册到Listener
实验前确保数据库已经启动,先停止掉Listener,并删除listener.ora,实现Listener的动态注册。
1
2
3
4
LSNRCTL> stop
Connecting to (ADDRESS=(PROTOCOL=tcp)(HOST=)(PORT=1521))
The command completed successfully
LSNRCTL>
获取到PMON的操作系统进程。
1
2
3
4
5
idle> select SPID,PROGRAM from v$process where PROGRAM like '%PMON%';

SPID                     PROGRAM
------------------------ ------------------------------------------------
29172                    oracle@localhost.localdomain (PMON)
用oradebug跟踪
1
2
3
4
5
idle> oradebug setospid 29172
Oracle pid: 2, Unix process pid: 29172, image: oracle@localhost.localdomain (PMON)

idle>  oradebug Event 10257 trace name context forever, level 16
Statement processed.
接下来开启Listener
1
2
3
4
5
6
7
8
9
10
11
12
13
14
15
16
17
18
19
20
21
22
LSNRCTL> start
Starting /u01/app/oracle/product/11.2.0/dbhome_1/bin/tnslsnr: please wait...

TNSLSNR for Linux: Version 11.2.0.1.0 - Production
Log messages written to /u01/app/oracle/diag/tnslsnr/localhost/listener/alert/log.xml
Listening on: (DESCRIPTION=(ADDRESS=(PROTOCOL=tcp)(HOST=localhost)(PORT=1521)))

Connecting to (ADDRESS=(PROTOCOL=tcp)(HOST=)(PORT=1521))
STATUS of the LISTENER
------------------------
Alias                     LISTENER
Version                   TNSLSNR for Linux: Version 11.2.0.1.0 - Production
Start Date                17-MAR-2013 11:33:07
Uptime                    0 days 0 hr. 0 min. 0 sec
Trace Level               off
Security                  ON: Local OS Authentication
SNMP                      OFF
Listener Log File         /u01/app/oracle/diag/tnslsnr/localhost/listener/alert/log.xml
Listening Endpoints Summary...
  (DESCRIPTION=(ADDRESS=(PROTOCOL=tcp)(HOST=localhost)(PORT=1521)))
The listener supports no services
The command completed successfully
status之后注意到还没有实例注册到Listener上。
1
2
3
4
5
6
7
8
9
10
11
12
13
14
15
16
LSNRCTL> status
Connecting to (ADDRESS=(PROTOCOL=tcp)(HOST=)(PORT=1521))
STATUS of the LISTENER
------------------------
Alias                     LISTENER
Version                   TNSLSNR for Linux: Version 11.2.0.1.0 - Production
Start Date                17-MAR-2013 11:33:07
Uptime                    0 days 0 hr. 0 min. 3 sec
Trace Level               off
Security                  ON: Local OS Authentication
SNMP                      OFF
Listener Log File         /u01/app/oracle/diag/tnslsnr/localhost/listener/alert/log.xml
Listening Endpoints Summary...
  (DESCRIPTION=(ADDRESS=(PROTOCOL=tcp)(HOST=localhost)(PORT=1521)))
The listener supports no services
The command completed successfully
再过一段时间再查询状态,发现有一个实例已经自动注册了。
1
2
3
4
5
6
7
8
9
10
11
12
13
14
15
16
17
18
LSNRCTL> status
Connecting to (ADDRESS=(PROTOCOL=tcp)(HOST=)(PORT=1521))
STATUS of the LISTENER
------------------------
Alias                     LISTENER
Version                   TNSLSNR for Linux: Version 11.2.0.1.0 - Production
Start Date                17-MAR-2013 11:33:07
Uptime                    0 days 0 hr. 2 min. 19 sec
Trace Level               off
Security                  ON: Local OS Authentication
SNMP                      OFF
Listener Log File         /u01/app/oracle/diag/tnslsnr/localhost/listener/alert/log.xml
Listening Endpoints Summary...
  (DESCRIPTION=(ADDRESS=(PROTOCOL=tcp)(HOST=localhost)(PORT=1521)))
Services Summary...
Service "agile9" has 1 instance(s).
  Instance "agile9", status READY, has 1 handler(s) for this service...
The command completed successfully
关闭oradebug后,查看PMON的trace日志,将会注意到有一下两行提示。PMON在默认60秒的时间间隔之内自动将实例注册到了Listener。
- kmmgdnu: agile9
- kmmlrl: instance load 1
.
1
2
3
4
5
idle> oradebug tracefile_name
/u01/app/oracle/diag/rdbms/agile9/agile9/trace/agile9_pmon_29172.trc

idle> oradebug Event 10257 trace name context OFF;
Statement processed.
.
1
2
3
4
5
6
7
8
*** 2013-03-17 11:32:46.658
kmmlrl: update for process drop delta: 52 52 24 26 149
kmmgdnu: agile9
		 goodness=0, delta=1,
		 flags=0x4:unblocked/not overloaded, update=0x6:G/D/-
kmmlrl: 24 processes
kmmlrl: instance load 1
kmmlrl: nsgr update returned 0